ENV 6932: Spring 2017
 Imaging Spectroscopy and Hyperspectral Image Analysis with Environmental Applications
Instructor: Professor Paul Gader
Class Times: M Period 4 – 5
W Period 4
Room: BLK 0315
Office: Weil Hall 575L Office Hours: M, T, W Period 6
Email: pgader@.ufl.edu Phone: 352-294-1629
Textbook: Instructor Notes and other Online Resources will be used (no cost)
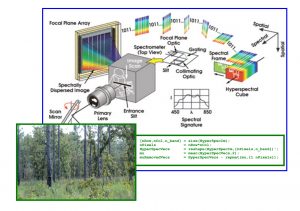
Topics: Imaging spectroscopy can be used to evalute health of terrestrial and marine ecosystems as well as agricultural crops. It is also used to detect invasive species, fires, methane leaks and to map species, chemicals, and organisims in an environment. Imaging spectrometers produce images, referred to as hyperspectral image, that have usually have anywhere from about 70 to about 450 bands of “color” at each pixel, including Ultra-Violet, Visible, and Infra-Red bands, most of which are not visible to the human eye. This course will focus on algorithms for extracting useful information from hyperspectral images. Students will work with real hyperspectral data sets.
Prerequisites. Since the focus is on processing, some programming experience is required. MATLAB will be the preferred programming environment. Undergraduate courses in Linear Algebra, and Calculus are also required because many algorithms will be modeled using Linear Algebra and derived using differential Calculus. Finally, an undergraduate course in Statistics is required because solving many of these problems requires statistical estimation of model parameters.
Evaluation and Grading:
There will be 2 tests and 2 computer projects. Each test will cover a subset of the material. Homework problems, mainly from the text, will be assigned. Some of the homework will require writing simple MATLAB scripts. Your knowledge of the homework will be evaluated by asking questions in class and putting problems identical or very similar to homework problems on the tests. MATLAB will be the preferred implementation environment for computer projects. Students should be prepared to demonstrate their projects by running their programs if asked. Each project will involve implementing a hyperspectral image analysis program, running it on some data, writing a report, and possibly demonstrating your program. Grades will be determined as follows:
Projects, 25% each x 2 projects = 50%
Tests, 25% each x 2 tests = 50%