The field of Aeroacoustics represents the study of the generation of sound by fluid flow and its propagation into its surroundings which places it at the union of acoustics and fluid dynamics. Jet flows are ubiquitous in engineering applications and are representative of a fundamental class of free shear flows. This site presents a discussion of the flow physics associated with the generation of noise which is radiated away from jet from both a historical perspective along with a new ongoing study.
Overview
Ever since the advent of jet aircraft in the first half of the twentieth century researchers have sought to understand and control the generation of from aircraft engines. Modern turbofan engines have many noise sources as depicted in the image below. Although all of the components contribute to overall noise profile of an engine jet aeroacoustics is generally concerned with the mixing noise and shock noise.
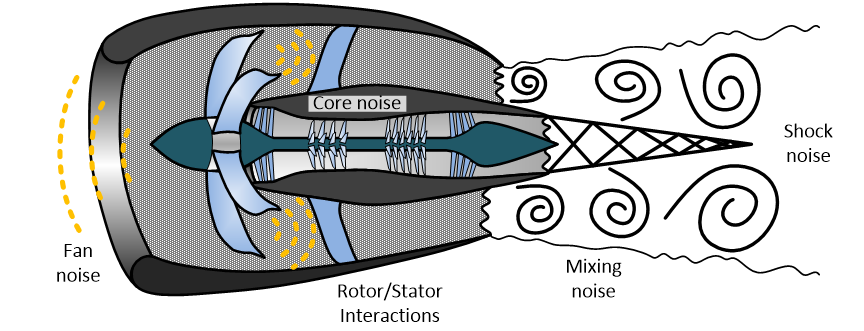 |
| Noise sources in a typical turbofan engine (June, 2017) |
The mixing noise downstream of the engine is associated turbulence generated noise is largely the main concern associated with jet noise with the jet under subsonic exit conditions. When one examines the pressures associated with a jet flow it can be broken down into several regions which will be used throughout this discussion. They are shown in the Schleiren image below as the hydrodynamic pressure (within the flow), the near field pressures and the far field pressures which represent the acoustics/noise one wishes to understand.
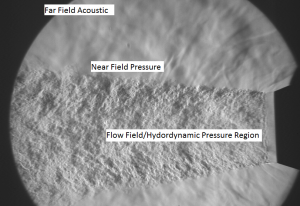 |
| Schlieren Photograph of a Subsonic Jet |
History
Initial theories of jet noise were formulated at a time when turbulent flows were viewed as an entirely chaotic phenomena. The turbulent jet was considered to comprise a disorganized ensemble of eddies of various scales, fluctuating energy being dissipated by means of an energy cascade from the largest scales to the smallest. The initial development of Lighthill’s acoustic analogy was formulated in this era and the components of the “source terms” were viewed in this context.
Present Study
The present study is being conducted in the the Anechoic Wind Tunnel in the Mechanical and Aerospace Department at the University of Florida and is designed to examine the sources within a moderate Mach number subsonic jet. The study combines Particle Image Velocimetry (PIV) measurements with a novel pressure sensor to examine hydrodynamic pressure fluctuations and relate them to the radiated noise.
PIV Measurements
PIV measurements have been acquired in the orientations shown below to allow for investigation of both streamwise evolution as well as the azimuthal variation.
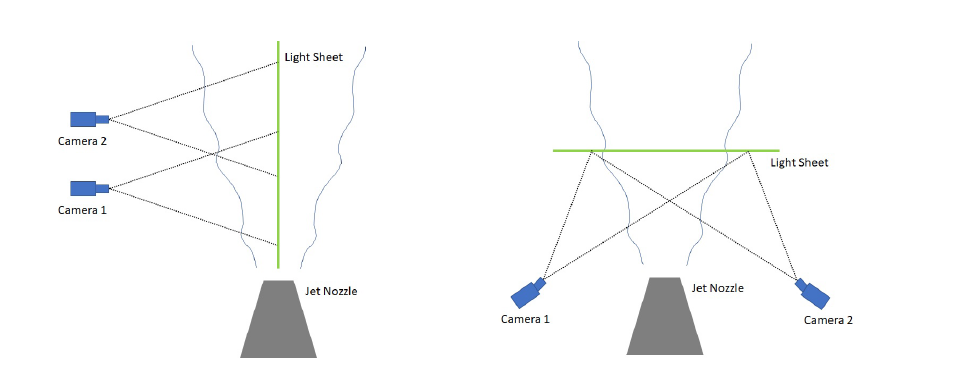 |
| PIV Configurations |
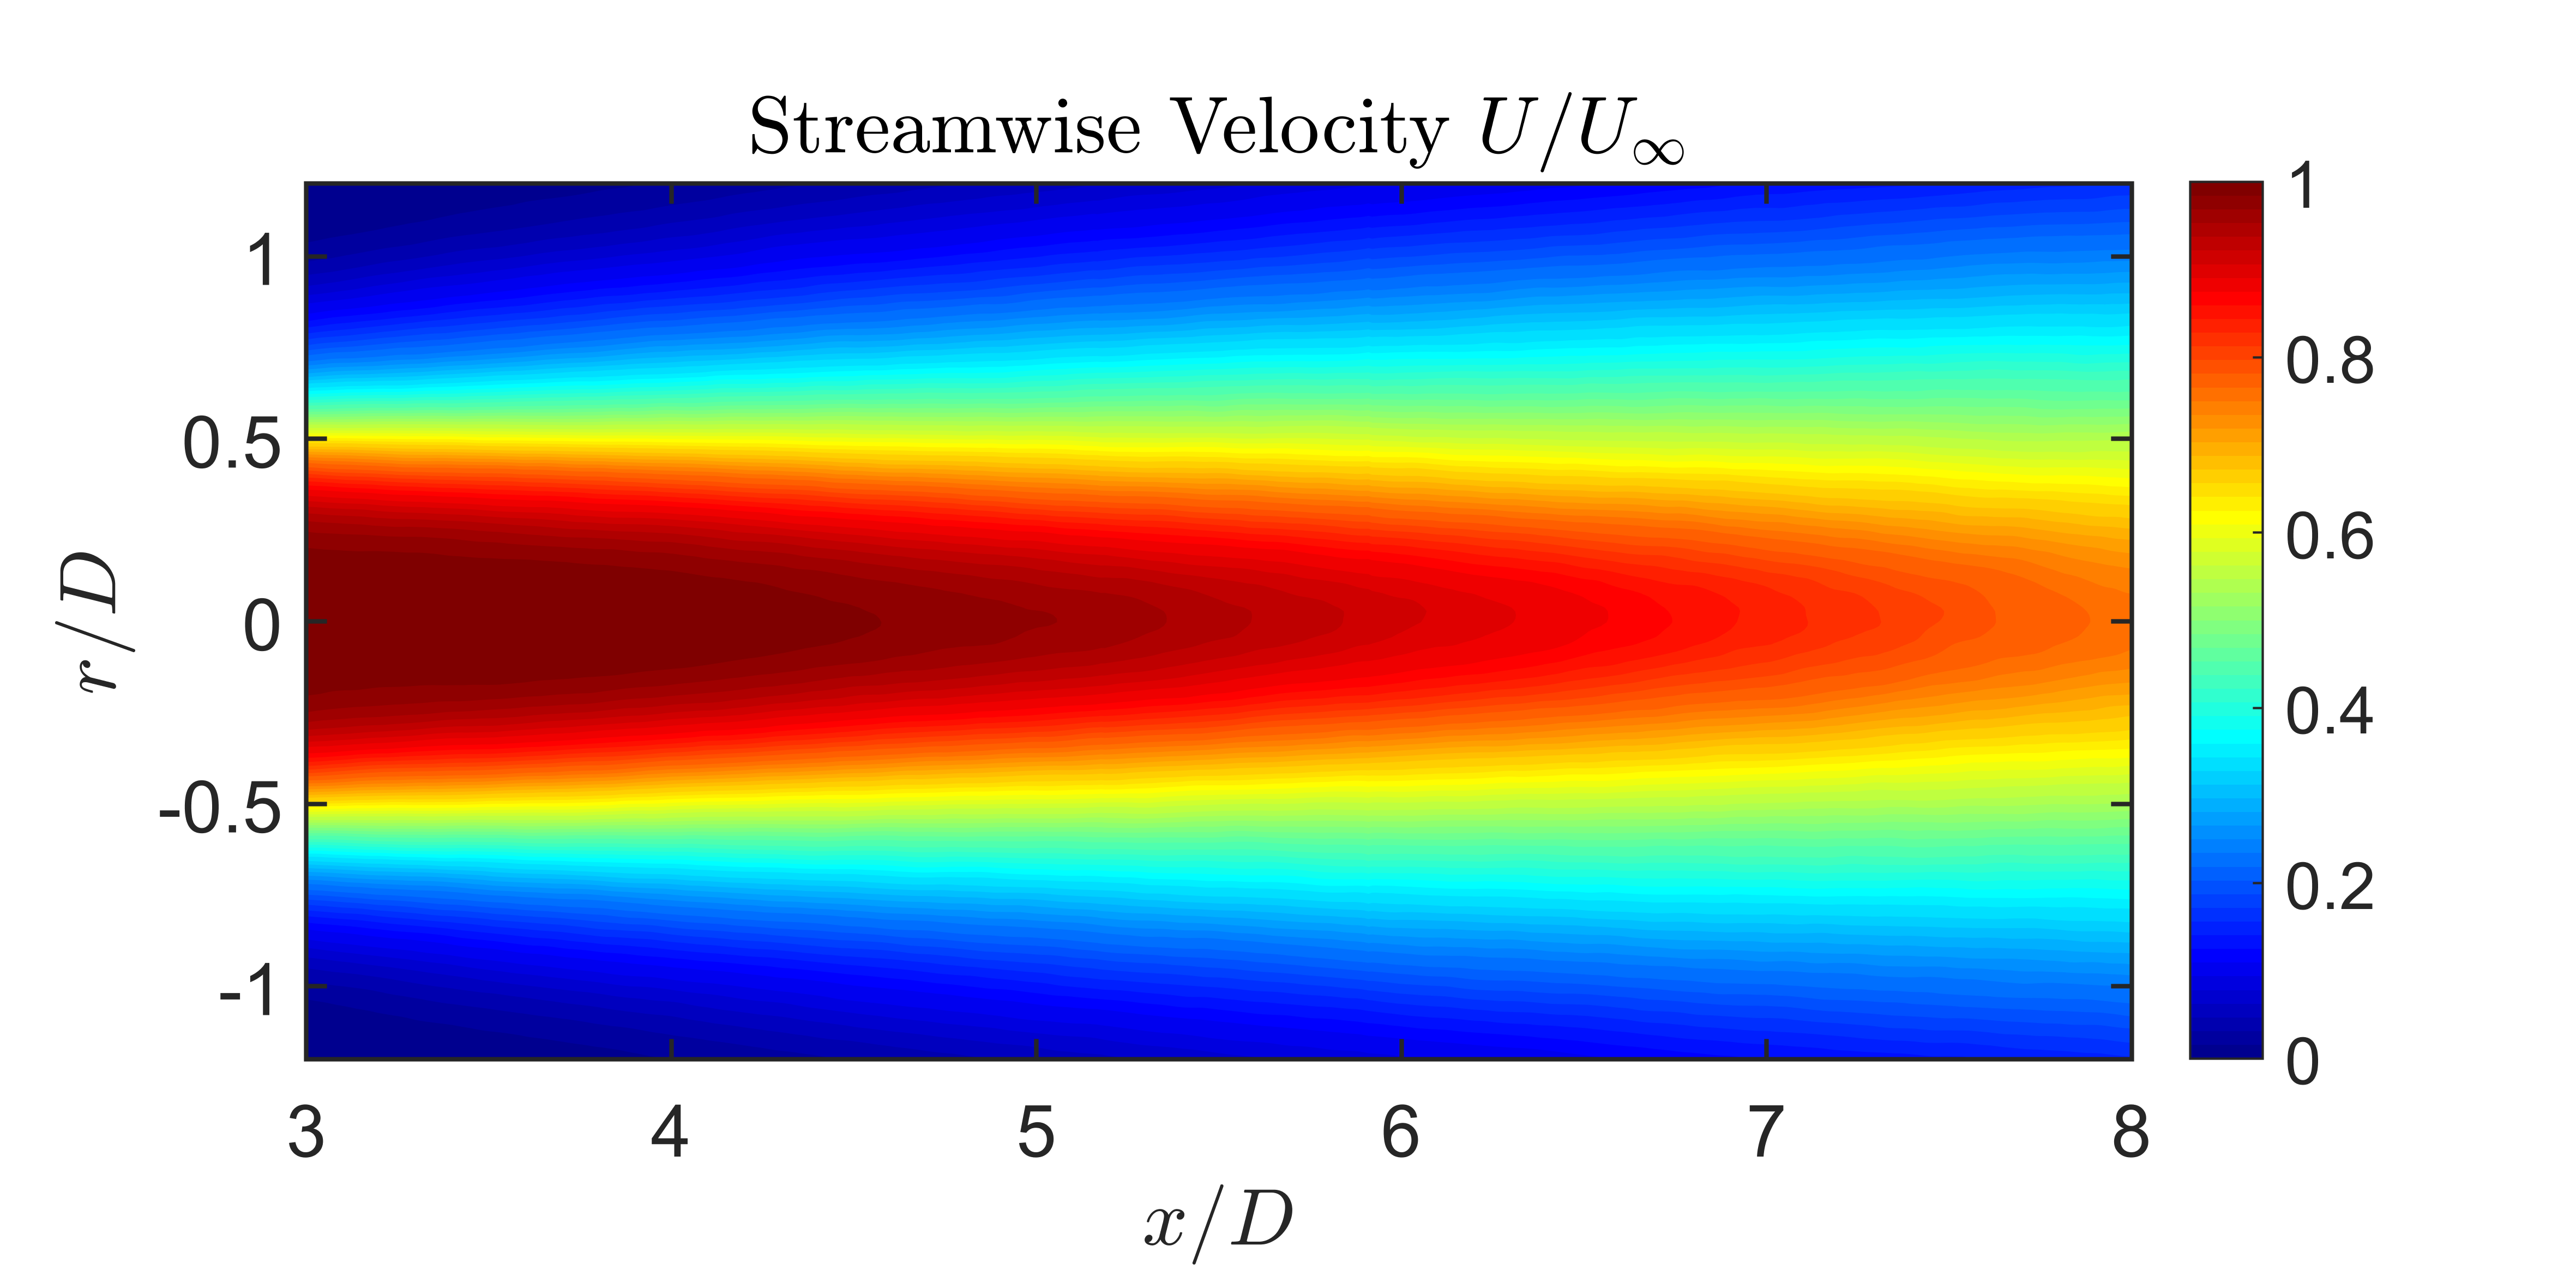
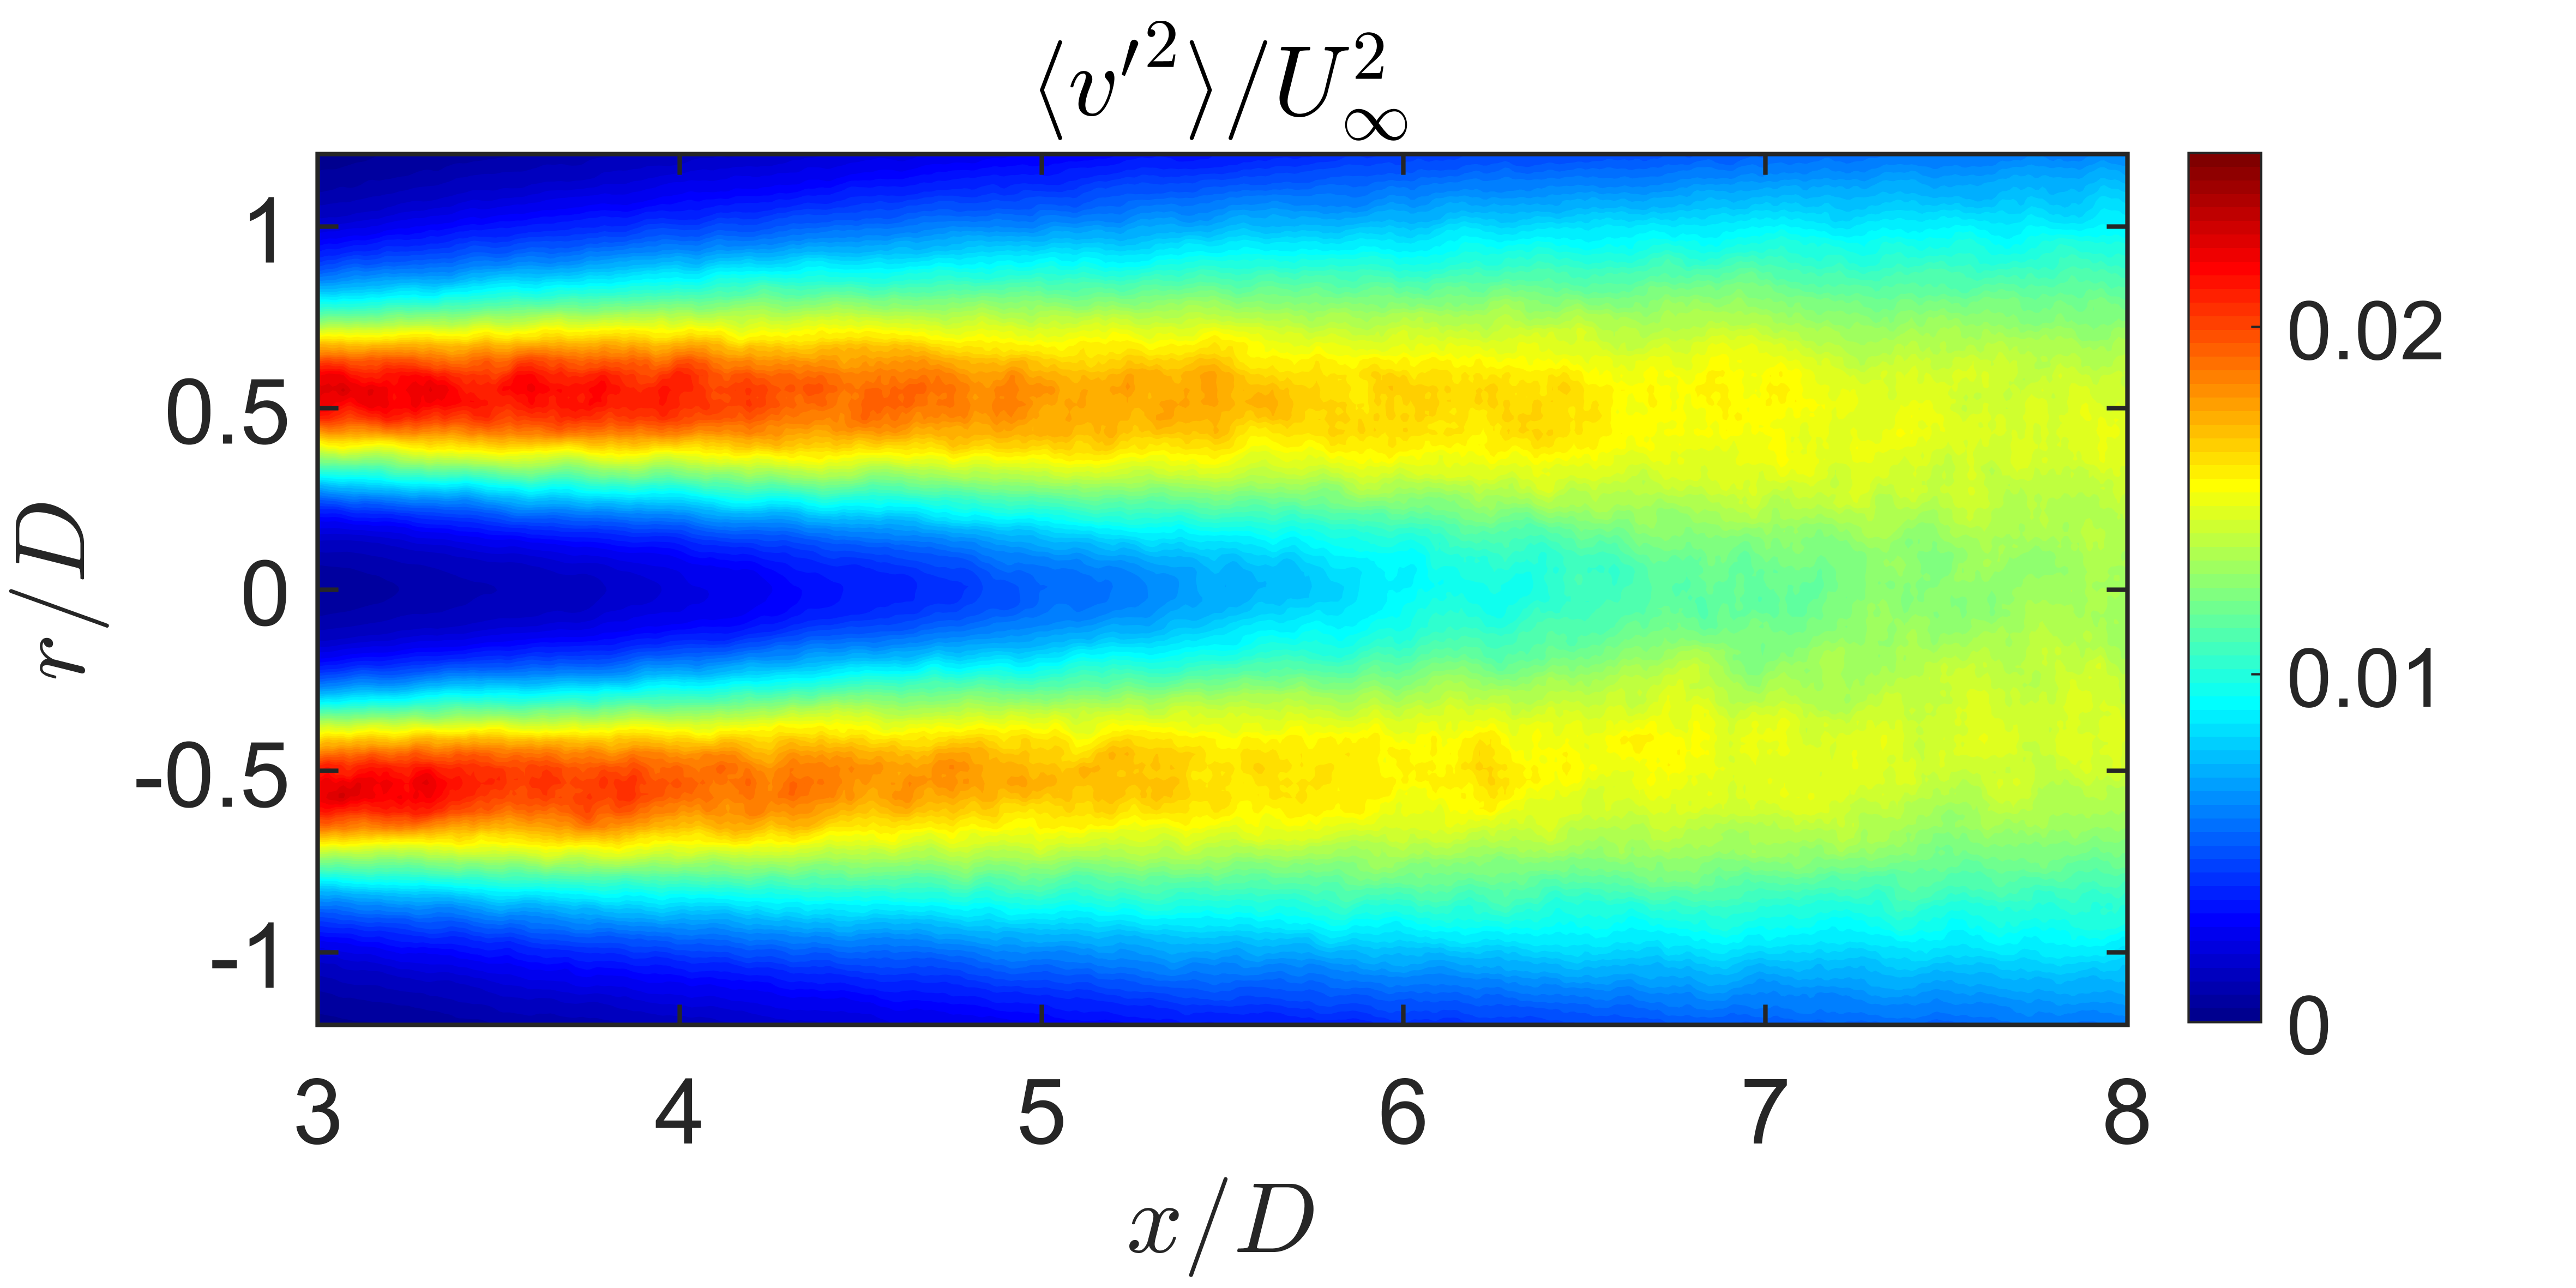
In the streamwise aligned plane the figure below shows the growth of the jet’s mean velocity field along with the turbulent fluctuations. The measurement domain extended through the noise producing region from 3 to 8 jet diameters downstream of the jet exit plane. These measurements show the collapse of the jet potential core as well as the development of the shear layers.
 |
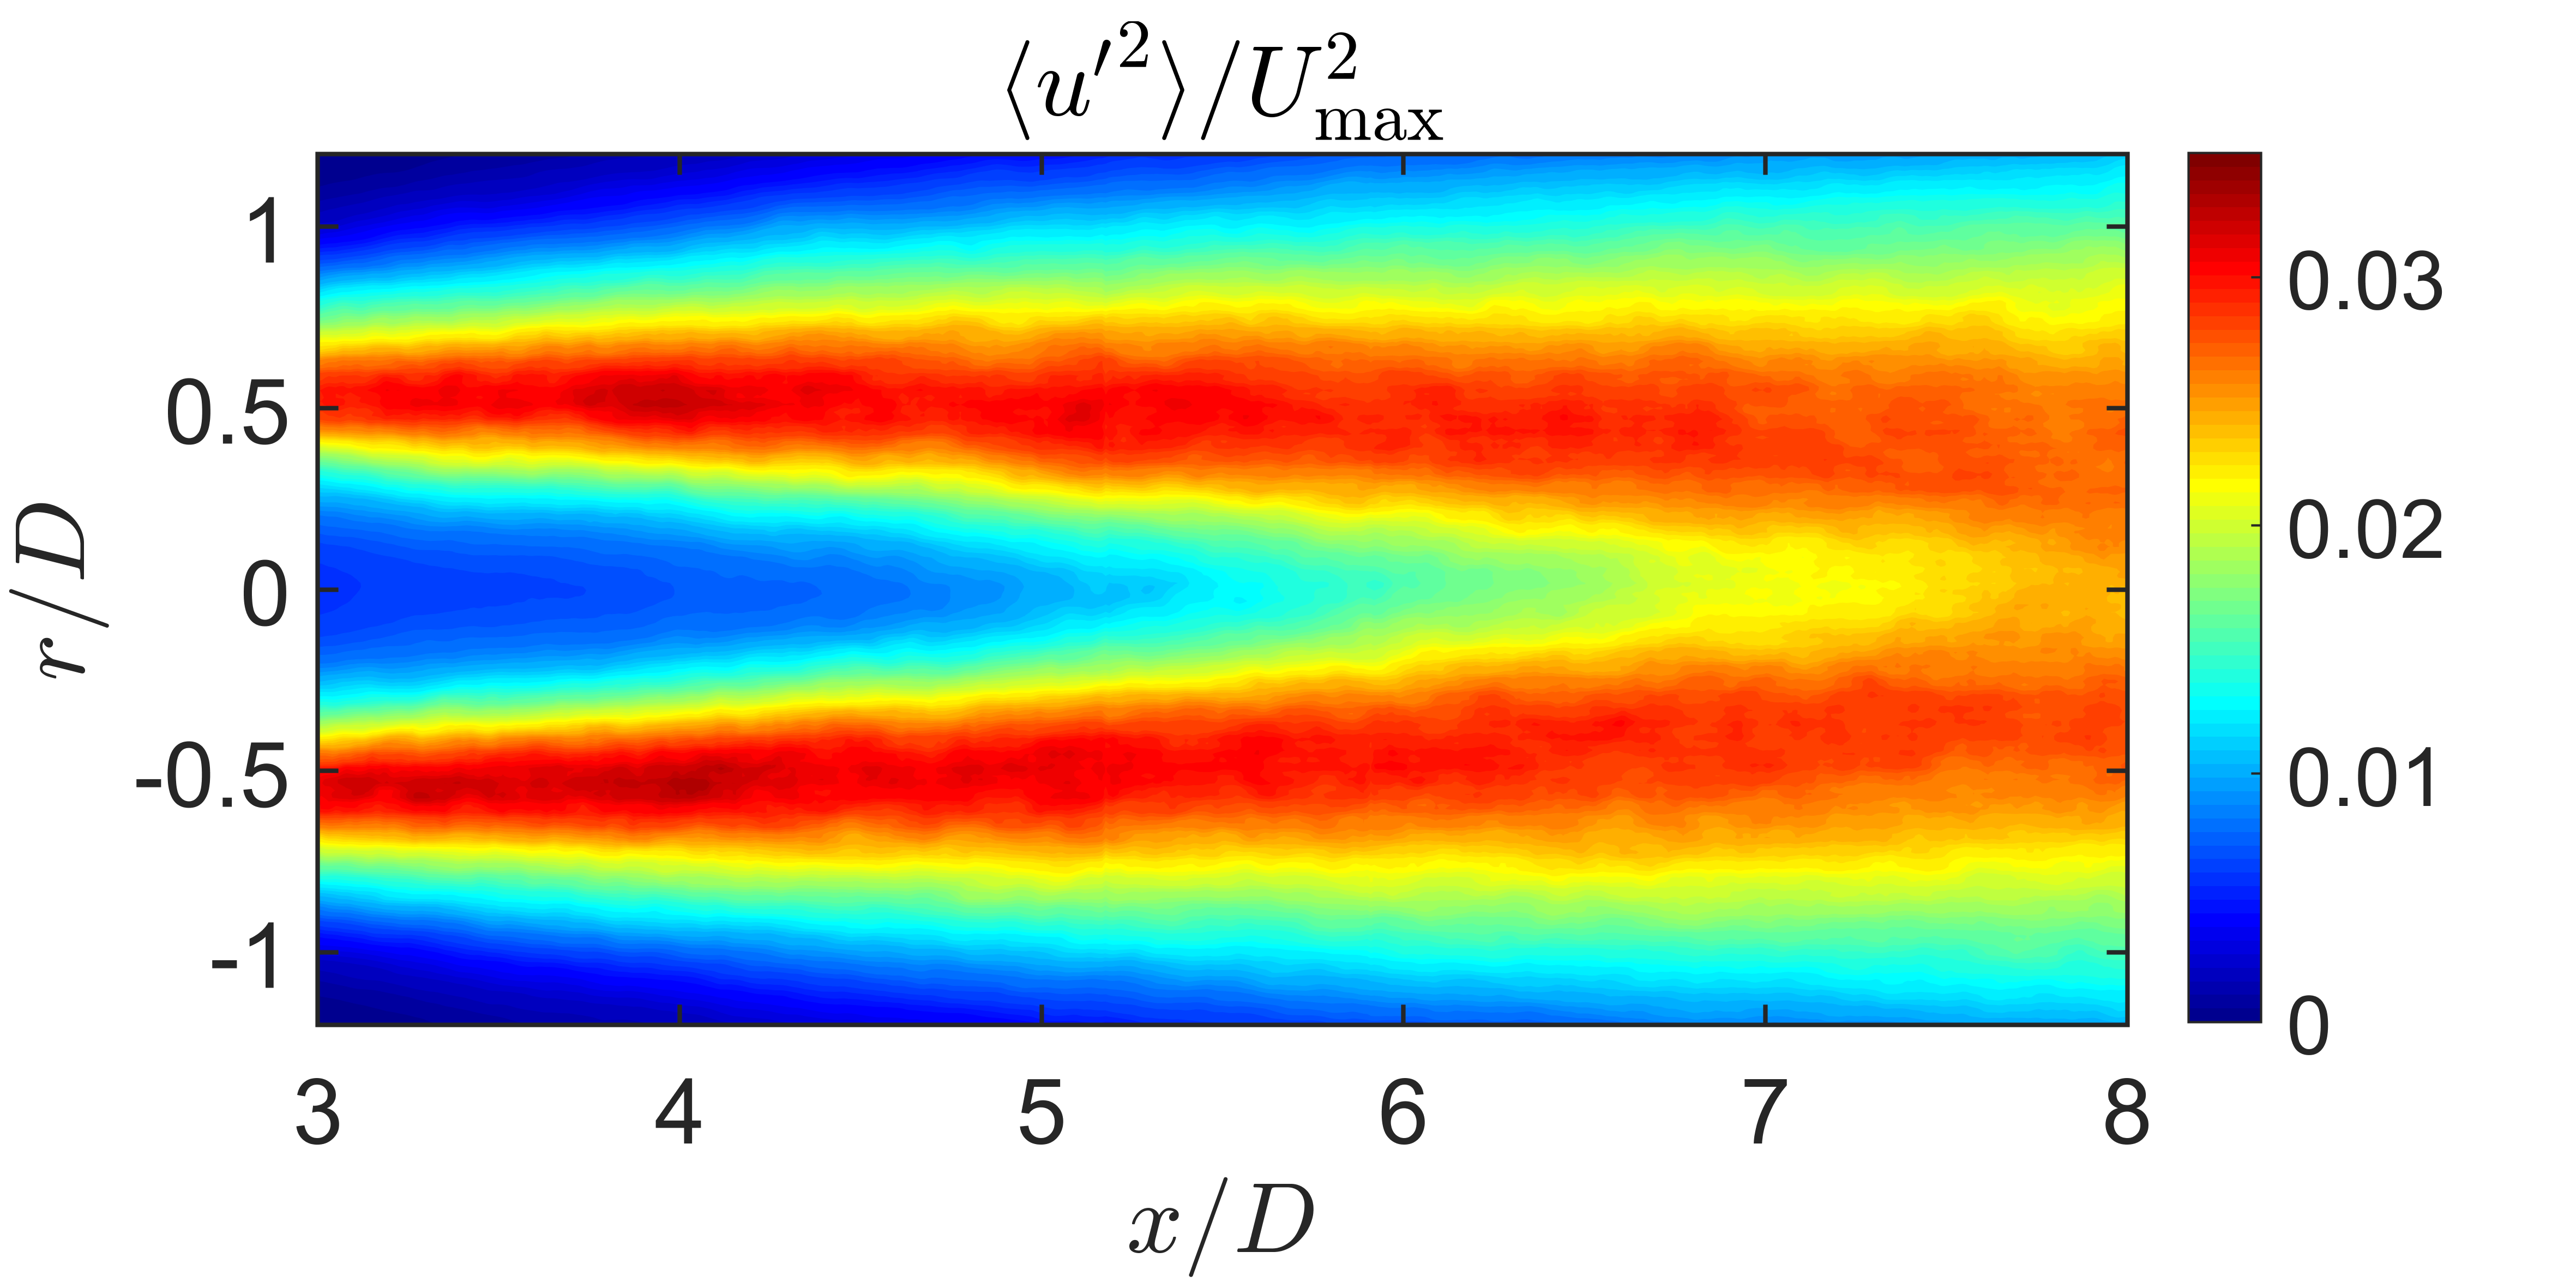 |
| Mean Streamwise Velocity | Mean Square Fluctuating Streamwise Velocity |
 |
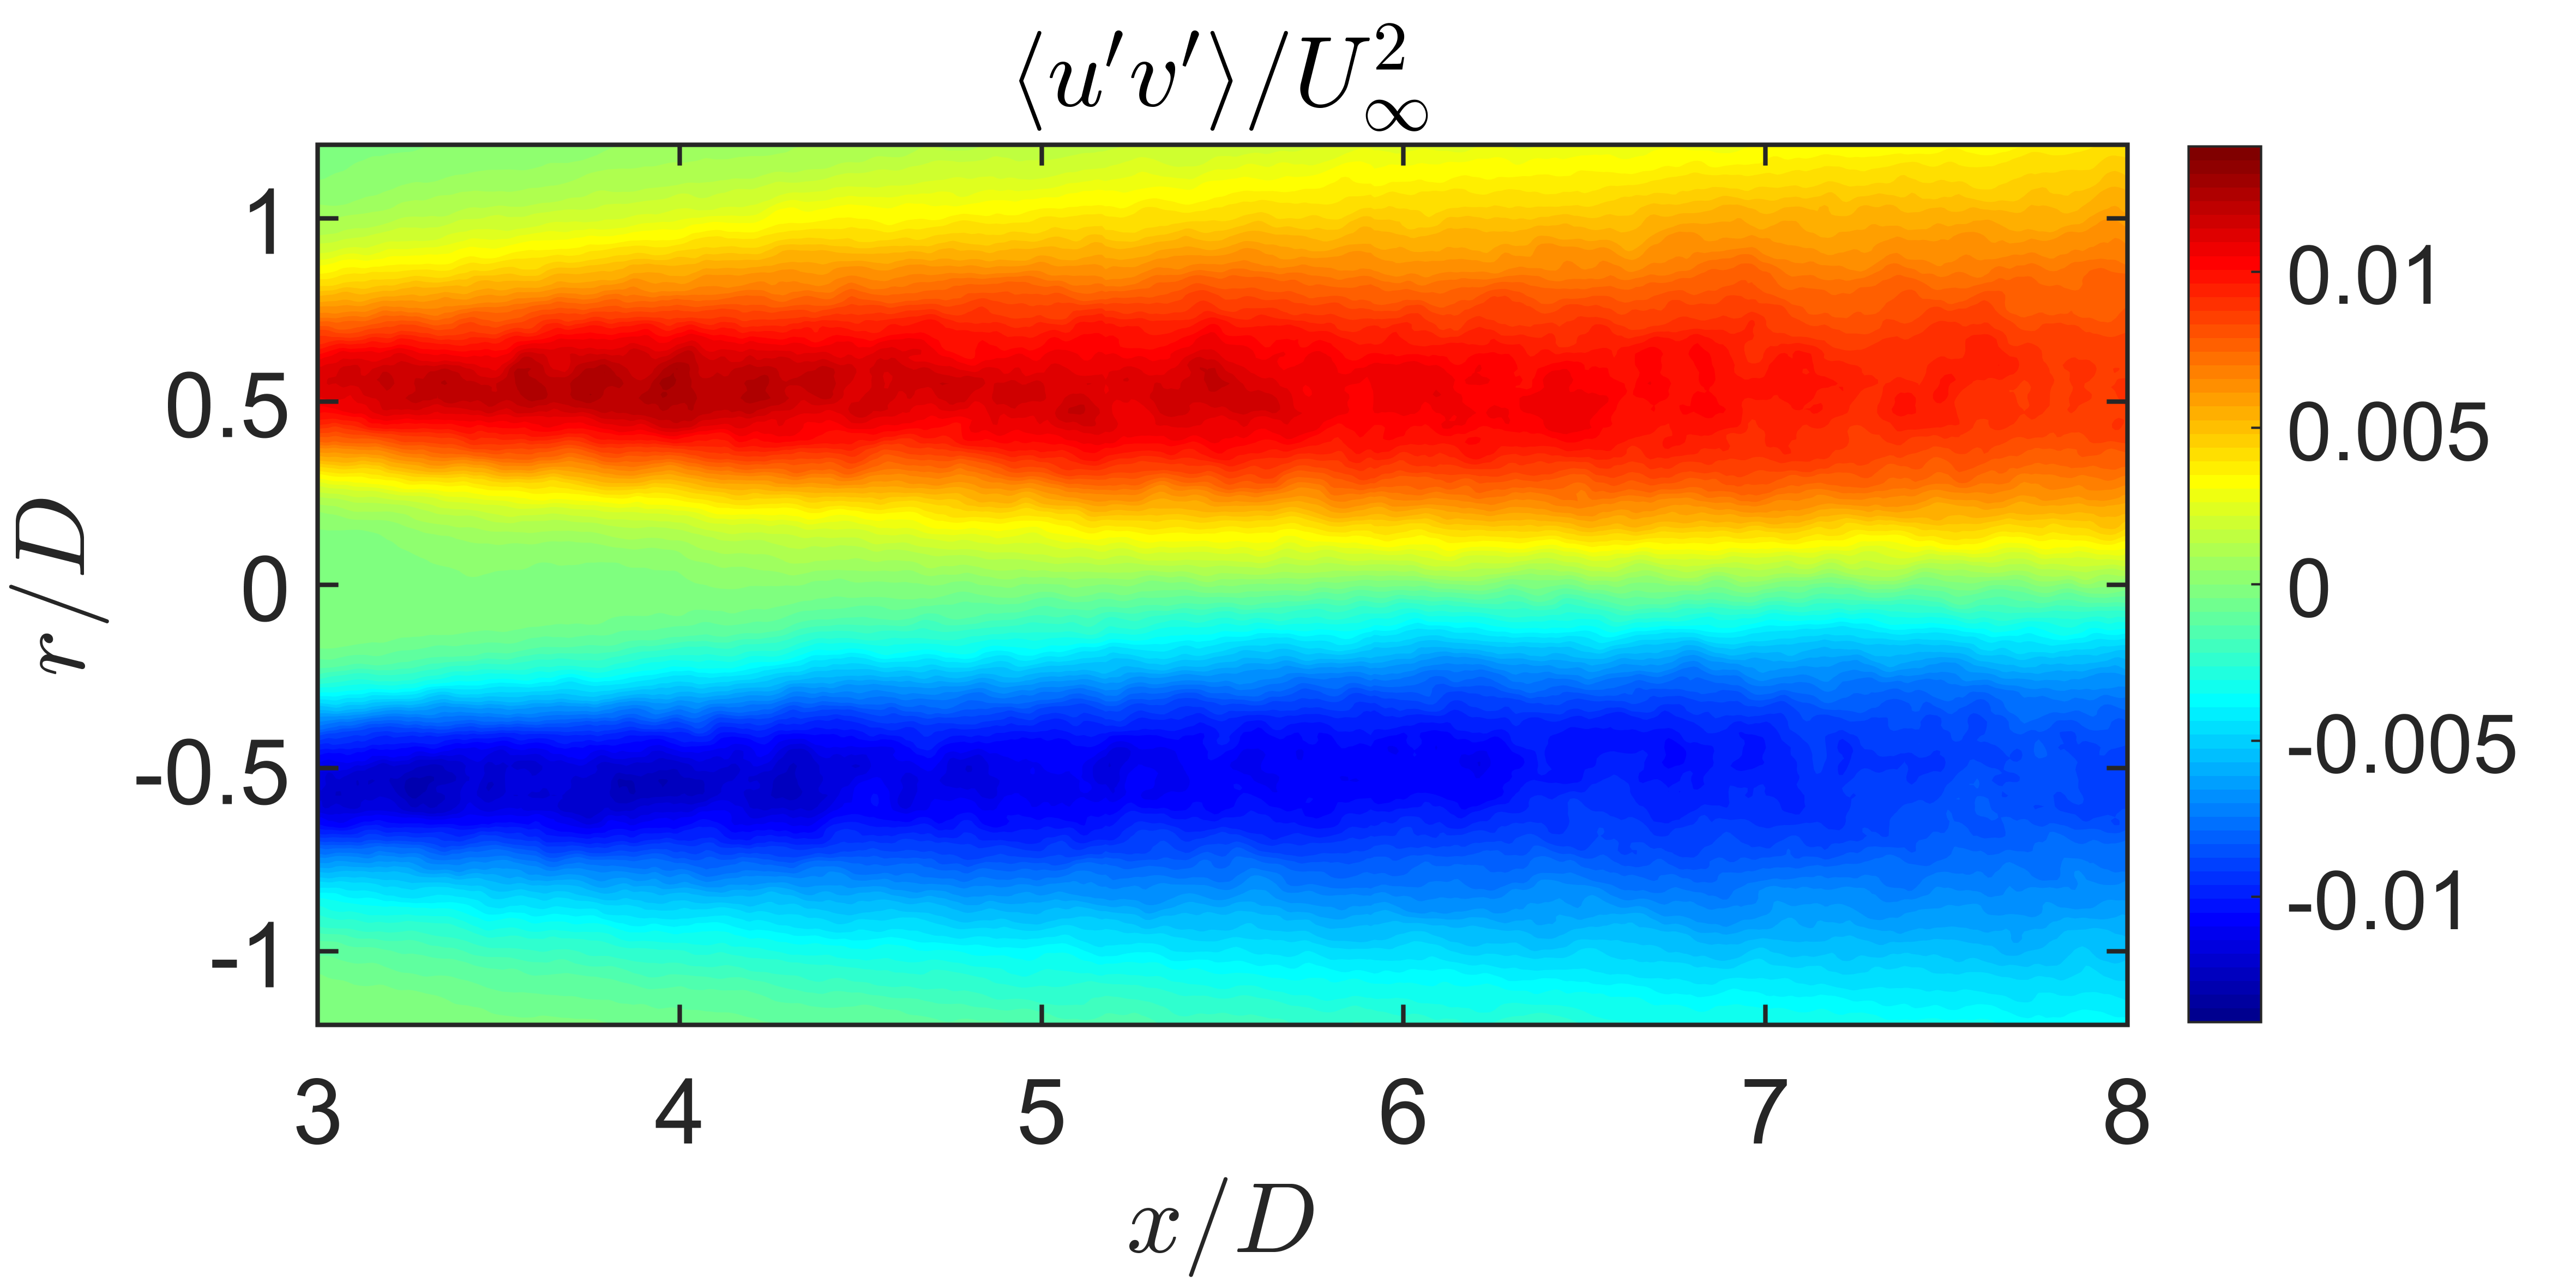 |
| Mean Square Fluctuating Radial Velocity | Shear Component of the Reynolds Stress |
| Velocity Fields from Streamwise Aligned PIV Measurements | |
Velocity measurements in the cross stream plan (shown below) show the axisymmetric nature of the jet and how the velocity field evolve. It should be noted that in this plane we have interpolated the PIV measurements onto a cylindrical grid.
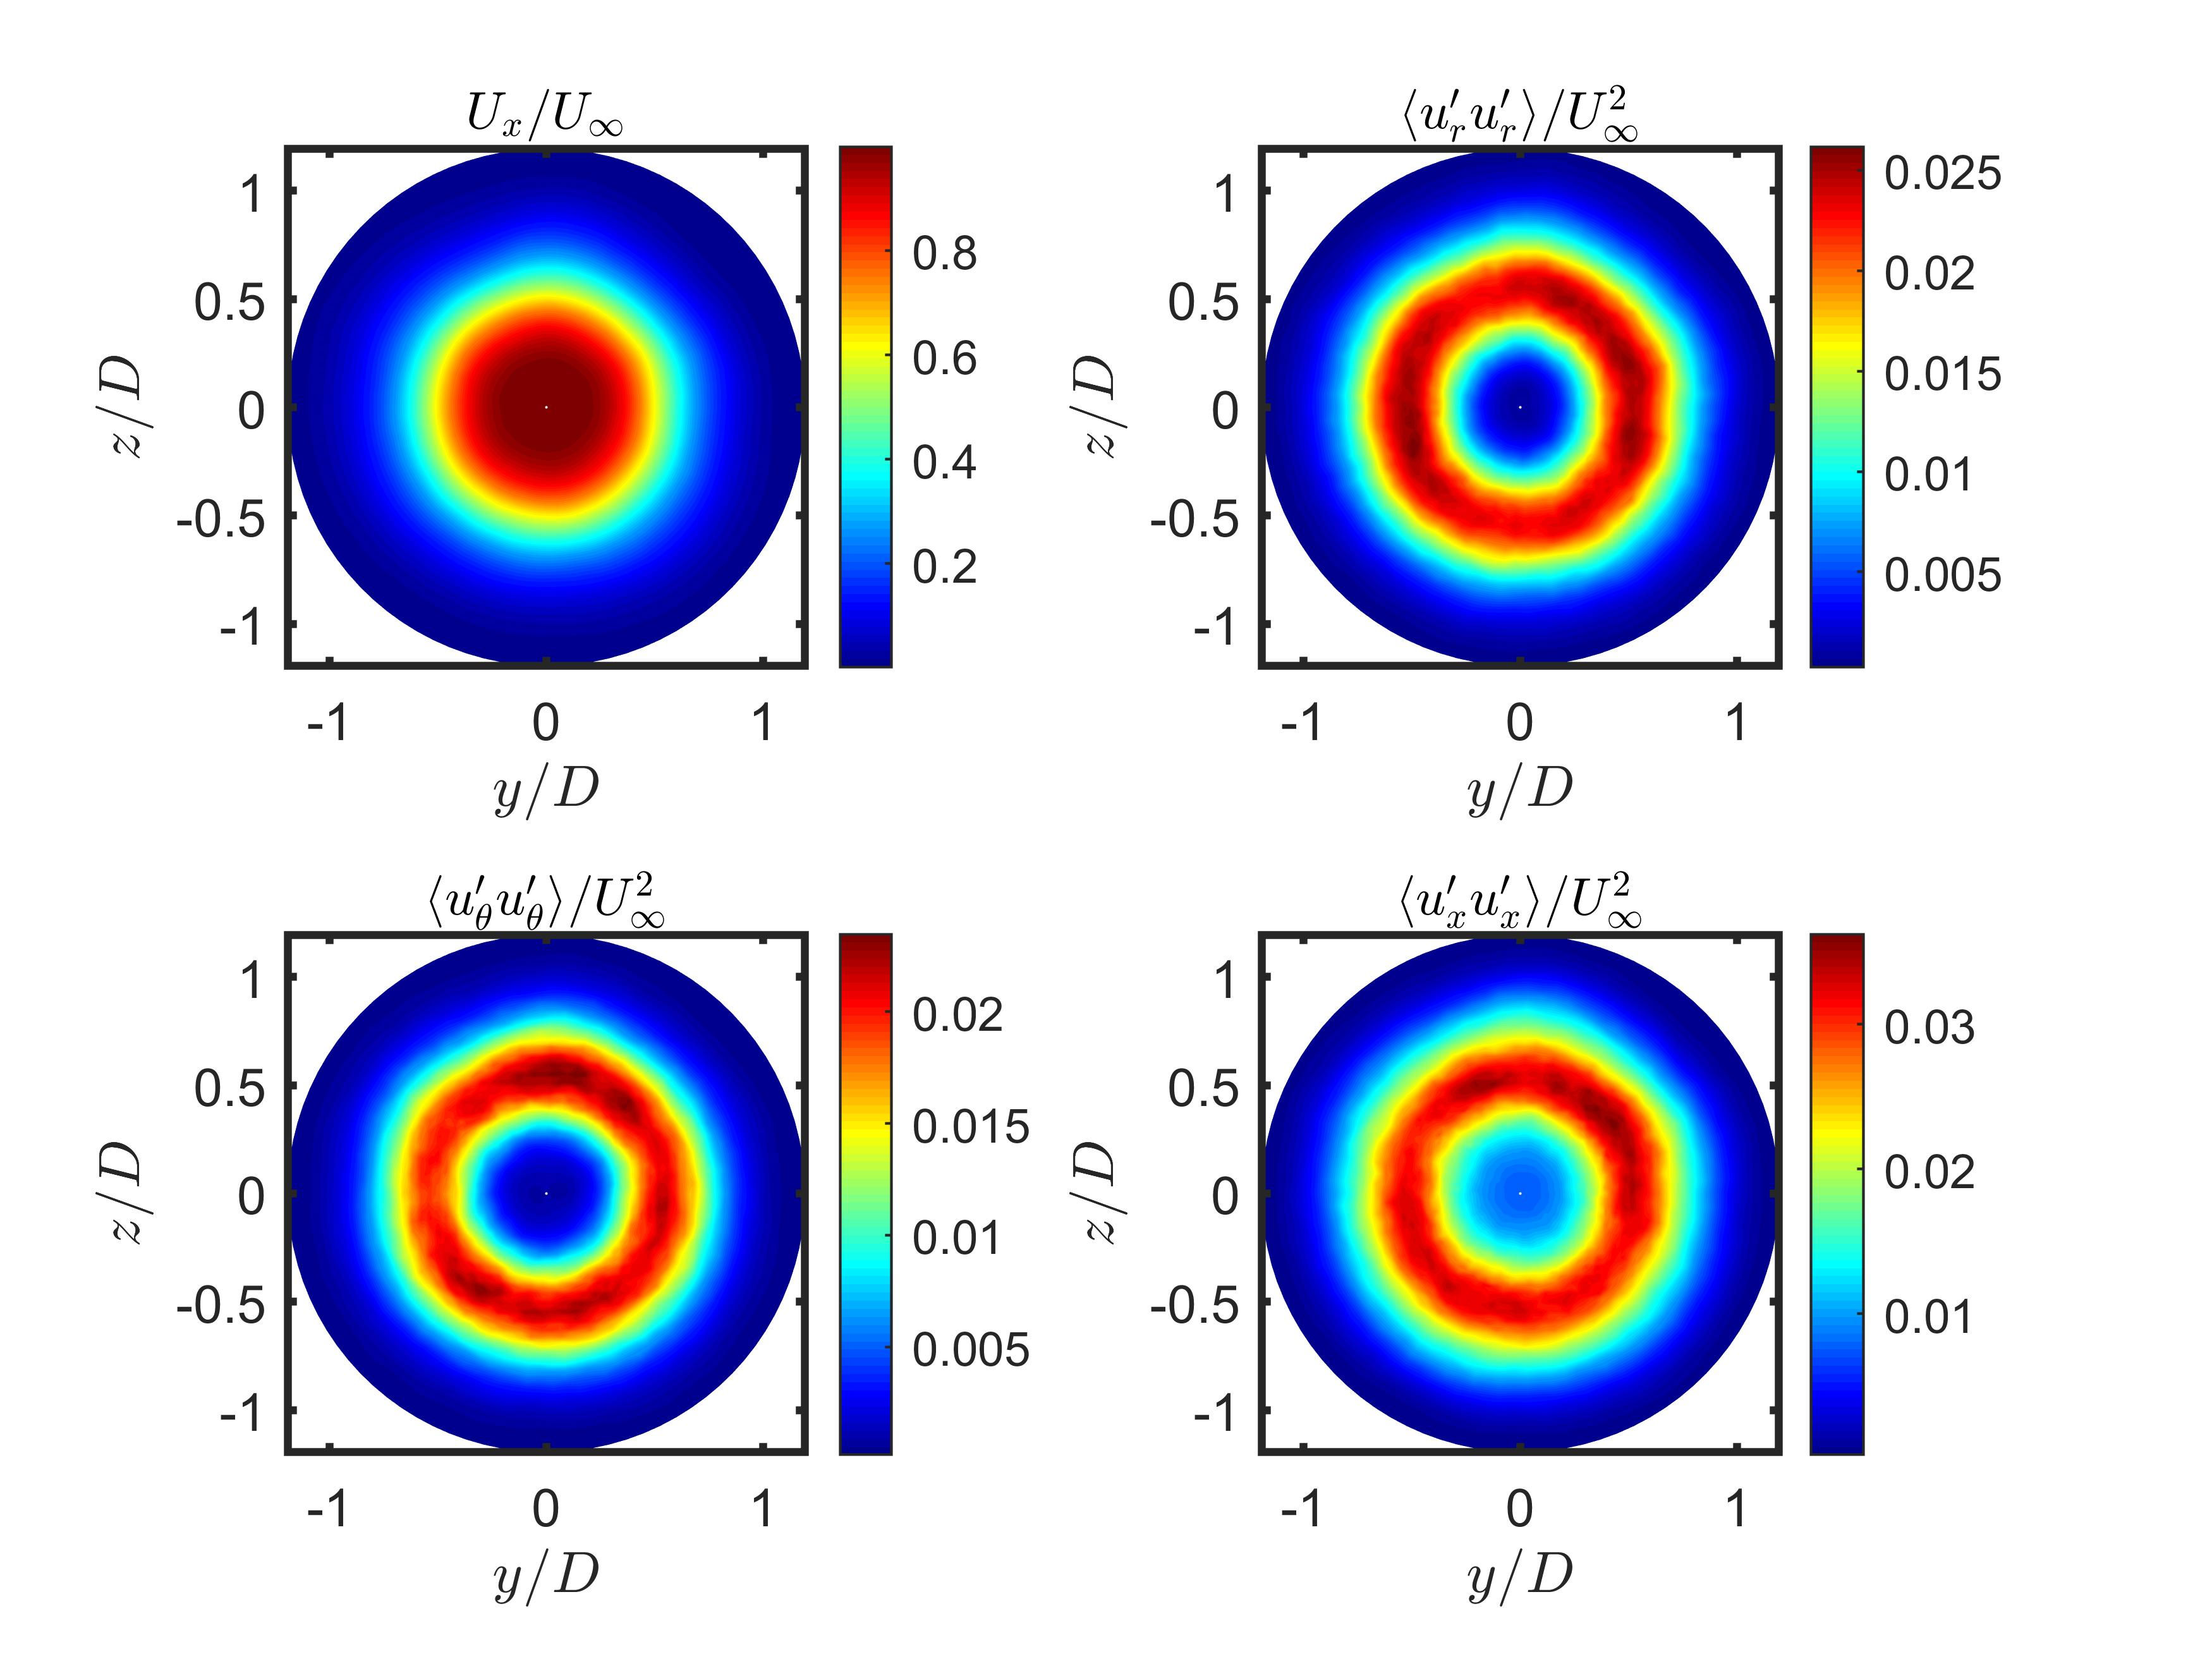 |
| Velocity Fields from Cross Plane PIV Measurements |
Acoustic Characterization
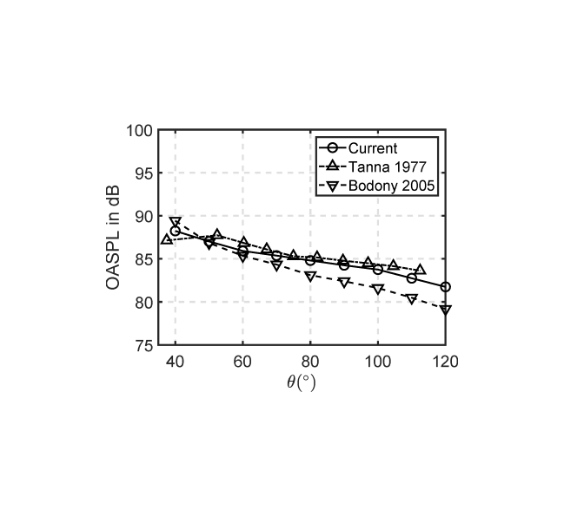
Figures below show the overall sound pressure level (OASPL) and the power spectra at M=0.5 and different polar angles. The maximum sound levels appear at polar angle of φ=40 deg. and Strouhal number St=0.3.
 |
|
Comparison of OASPL (ref. 20 micro Pa) at different polar angles. Data from Tanna (1977) and Bodony (2005) are also plotted for comparison. |
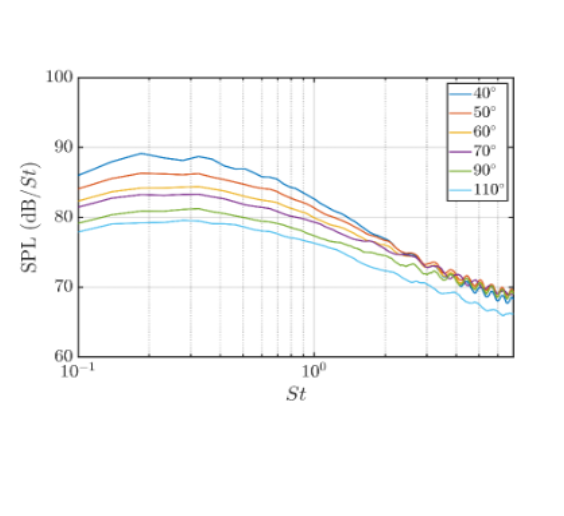 |
| Power spectral density at different polar angles with a polar distance of 40 D |
Inflow fluctuating static pressure measurements
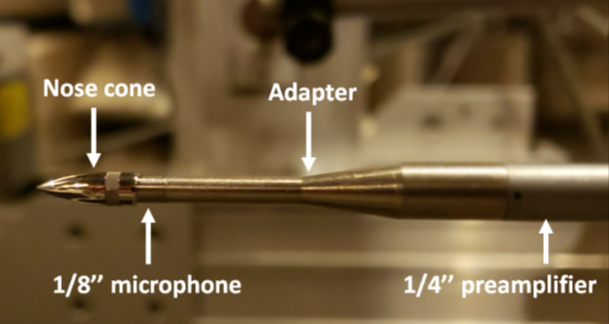
The inflow static pressure fluctuations within the jet has the potential to depict inflow sources of the jet noise. Here the fluctuating static pressure were measured using both B&K 1/8” and GRAS 46DD 1/8″ microphones both with an aerodynamically shaped nose cones.
 |
|
Configuration of the assembled B&K pressure microphone |
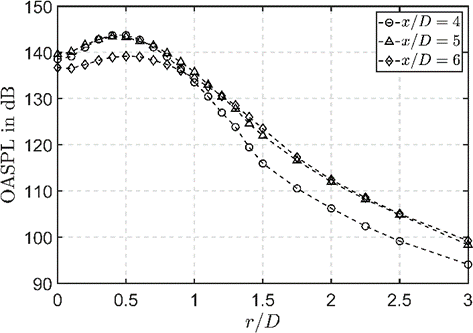
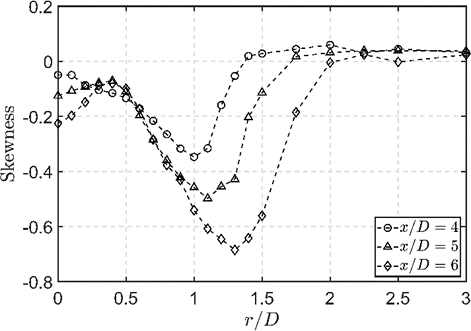
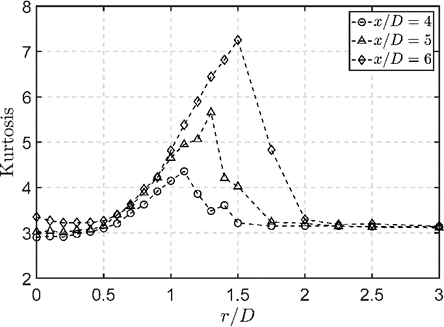
The OASPL, skewness and kurtosis factors at different streamwise and radial locations are presented in the figures below. The OASPL profiles describe the transition of the pressure intensity while the skewness and kurtosis coefficients indicate strong intermittent events inside the flow regime.
|
||||
| OASPL, Skewness and Kurtosis factors at x/D=4,5,6 and radial locations between 0 D and 3 D. | ||||
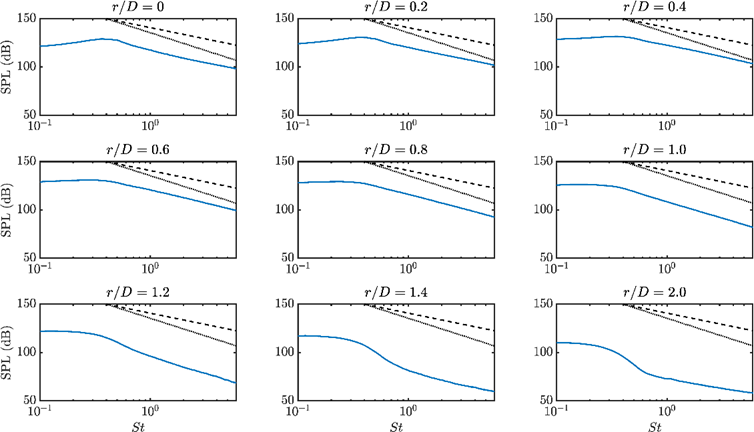
The figure below shows the evolution of sound pressure levels calculated at . The classic -7/3 (dashed line) and -11/3 (dotted line) scaling laws from George et al. are also plotted for comparison. When , The spectra peak around St = 0.4, followed by an exponential roll-off asymptotic to -7/3. From , the Strouhal 0.4 peak is replaced by a broadband event between St = 0.1~0.3, and the roll-off rate gradually increases and asymptotes to -11/3 at . Moving outward, the pressure probe approaches the acoustic near field and the pressure spectra begin to possess the characteristics of the near field ones, with a fast decay rate inside the inertial subrange followed by a slower roll-off in the range of the propagating pressure field. Identical trend has been observed at 5 and 6, the only differences are the overall amplitudes and the radial extension of each stage.
 |
|
Pressure spectra at x/D=5. Dashed line: -7/3 line; dotted line: -11/3 line |
The figure below presents the pressure scalograms over a short period of time at 3 different radial locations. Comparatively more source activities are detected at . As increases, source activities become more dispersed meanwhile apparent attenuation is observed at the outer edge of the shear layer.
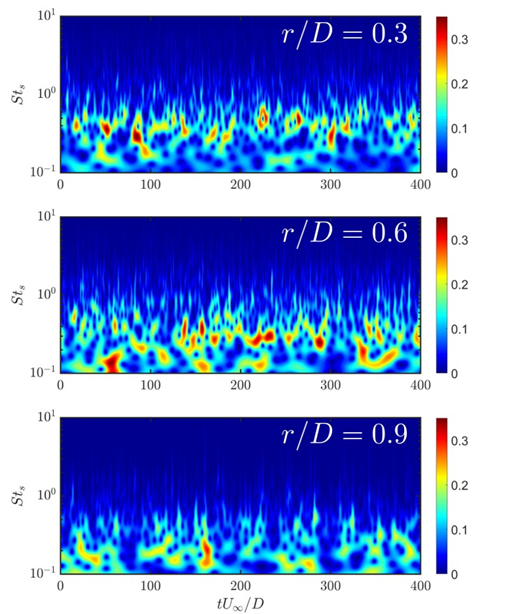 |
| Non-dimensionalized wavelet scalograms |w| at x/D=5 over a short period of time. |
Acoustic/Hydrodynamic Pressure Separation
The inflow measured pressure will consist of fluctuations associated with both acoustic and hydrodynamic pressure fluctuations. The hydrodynamic pressure represents the portion of the pressure possessing subsonic phase speeds in the wavenumber-frequency space, and it is quite unbiased by the compressibility in the flow. While the acoustic counterpart is the pressure components owning supersonic phase speeds which is dominated by random fluctuations at higher frequencies. The ability to separate the various components of the pressure can prove beneficial if one desires to apply flow control to alter the noise radiated from the jet. To separate the hydrodynamic pressure from its acoustic counterpart two different methods have been to the pressure measured at x=D = 5. The separation techniques are based on the assumption that the hydrodynamic component of the in-flow fluctuating pressure, which is associated with the convecting coherent eddies inside the flow field, correlates well with the compressed wavelet function [Grizzi and Camussi, 2012], while the acoustic pressure associated with homogeneous and fine-scaled eddies are less significant in the time-scale space [Mancinelli et al, 2017]. By selecting a threshold T the hydrodynamic component of the fluctuating pressure can be reconstructed using the wavelet coefficients exceeding the certain threshold in an absolute sense. Therefore the wavelet coefficients can be divided into two portions, the part greater than T in magnitude is denoted representing the hydrodynamic component of the signal p’h and the remaining coefficients which are less than the threshold is denoted by Wa, indicating the acoustic counterpart p’a. Method 1 involves the use of synchronous turbulent velocity measurements with the pressure measurements and portion of the fluctuating pressure that correlates well with the turbulent velocity is assumed to be the hydrodynamic portion. While Method 2 determines the threshold from a empirically determined relationship developed in Grizzi and Camussi, 2012. Further details of the both methods can be found in the above mentioned references and Li and Ukeiley, 2021.
 |
| Sound Pressure Level Spectra of the original, hydrodynamic and acoustic pressure (p’, p’h, p’a, respectively) measured at x=D = 5 using Method 1. (a) r=D = 0:2 and (b) r=D = 1. |
The figure above shows the results from Method 1 for radial locations at 5 jet diameters downstream of the jet exit plane. Here the hydrodynamic component preserves the shape of the original pressure spectra around the low frequency peaks which are associated with the large-scale coherent structures. Then the hydrodynamic pressure decays rapidly and becomes insignificant at high frequencies. The acoustic pressure is representative of the original spectra in the higher frequency range. Comparatively it holds a broadband energy distribution although the energy contained at low frequencies is still small compared to the original signal for both instances. Similar features can be found from the separation results implemented by Method 2.
Novel Pressure Sensor
The introduction of an aerodynamic probe into the flow of a jet can generate acoustic tones that are unrelated to the jet noise and undesirable to measure. Therefore, a novel pressure sensor was developed to reduce the presence of this flow-induced self-noise. The design of this sensor was borrowed from previous work at NASA Ames Research Center, which implemented a four to one prolate hemispheroid geometry for the profile of the nose cone of the probe [Allen and Soderman, 1993]. Pressure fluctuations due to the presence of the probe are reduced by the less angular shape of the nose cone and further proximity of the pressure ports from the nose cone. Consequently, the inflow static pressure measured by the diaphragm-based pressure sensor more closely resembles the natural pressure field that would occur without the presence of the probe. Some images of the new probe are shown below.
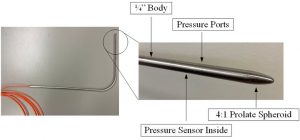 |
| Images of the new probe design |
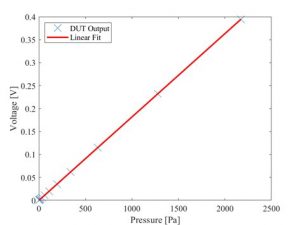
Piezoelectric pressure transduction was chosen for the sensor seated inside the probe body. The sensor was calibrated in a plane wave tube to ensure it met the necessary frequency and pressure response characteristics for this application. The results shown in the figures below revealed a linear pressure response from 90 to 160 dB (re. 20 µPa) and a sensitivity of 182 µV/Pa, which remained constant up to the maximum testable frequency of 20 kHz. Theoretically, the sensor should have a constant response up to a mechanical resonance of around 120 kHz.
 |
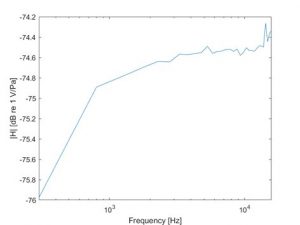 |
| Sensitivity and frequency response magnitude plots of piezoelectric pressure sensor. | |
Requests for Information
All requests for information, comments on content or data regarding this project should be directed to Prof. Lawrence Ukeiley (ukeiley @ufl.edu)
|
This work is sponsored by NSF Grant # 1704768 PI’s L. Ukeiley and M. Sheplak |
 |
