 |
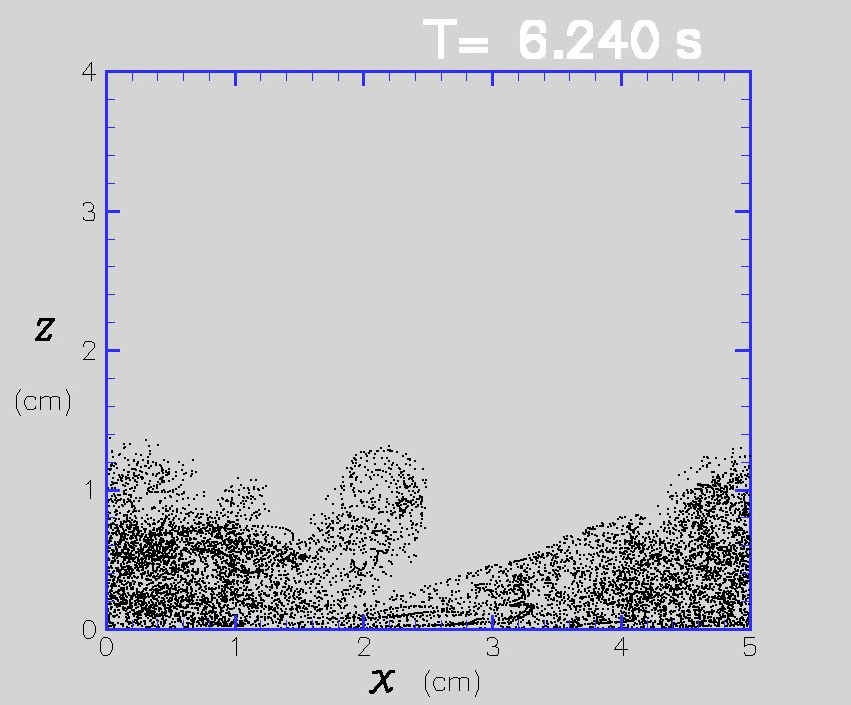
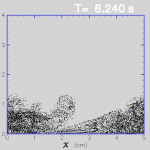
Lagrangian particles in the wave bottom boundary layer during transition. 6 second wave period – side view. |
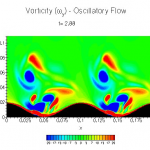 |
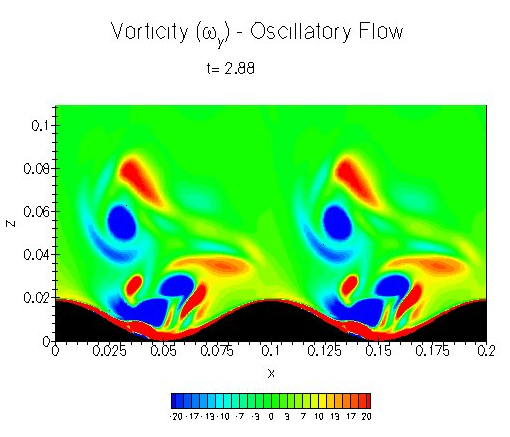
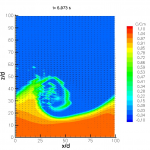
Vorticity fields from calculations of flow over a sand ripple. |
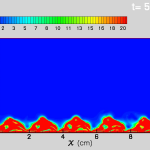 |
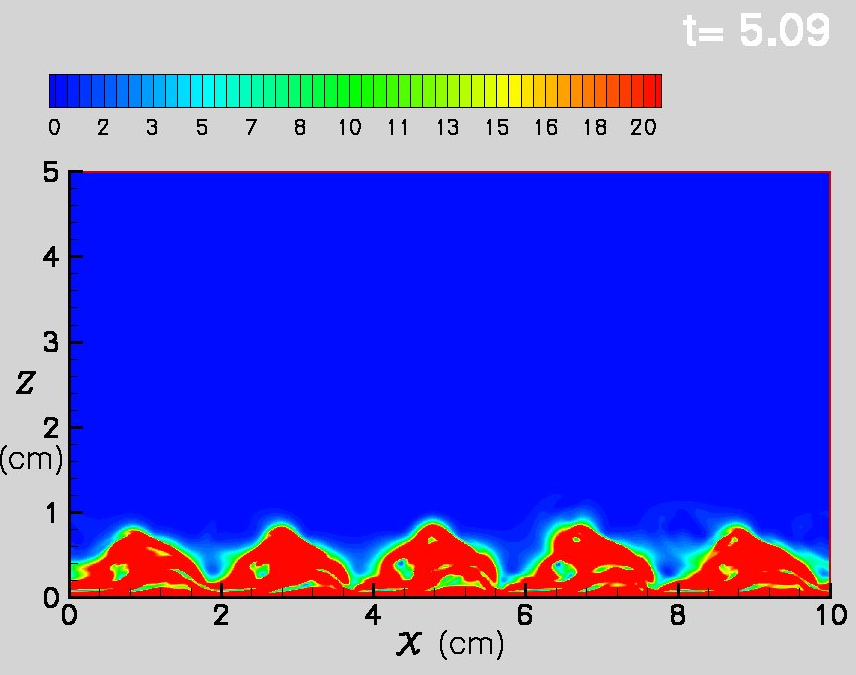
Kinetic energy dissipation rate for simulations of the wave bottom boundary layer over a smooth surface. 5 second period, Um = 80 cm/s, side view (x-z plane). |
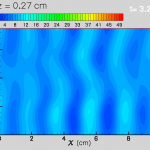 |
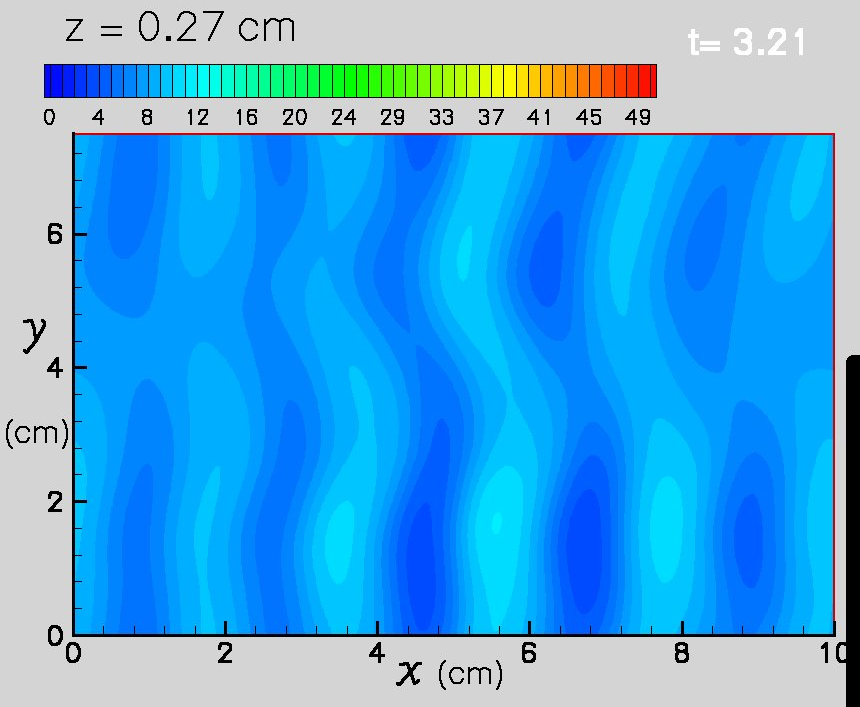
Kinetic energy dissipation rate for simulations of the wave bottom boundary layer over a smooth surface. Top view (x-z plane). |
 |
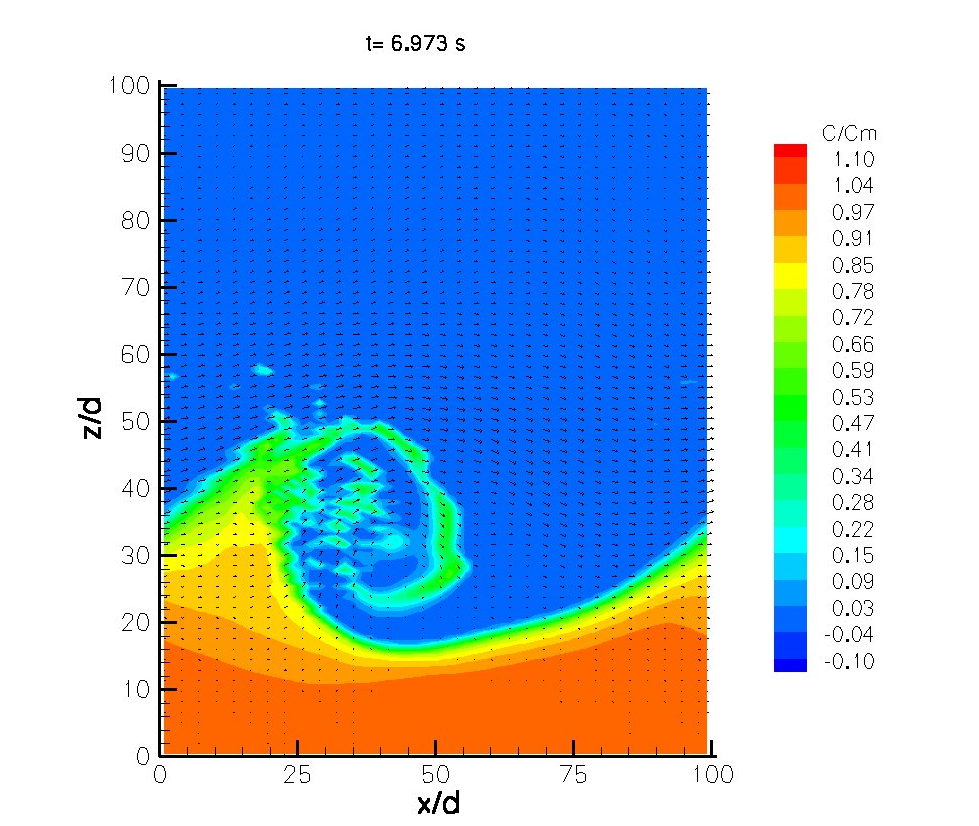
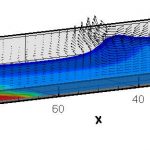
Sheet flow simulation with a two-phase variable density model. A vertical plane of the reference concentration and velocity vectors from a 3D simulation are shown. |
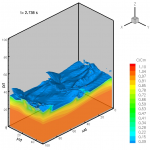 |
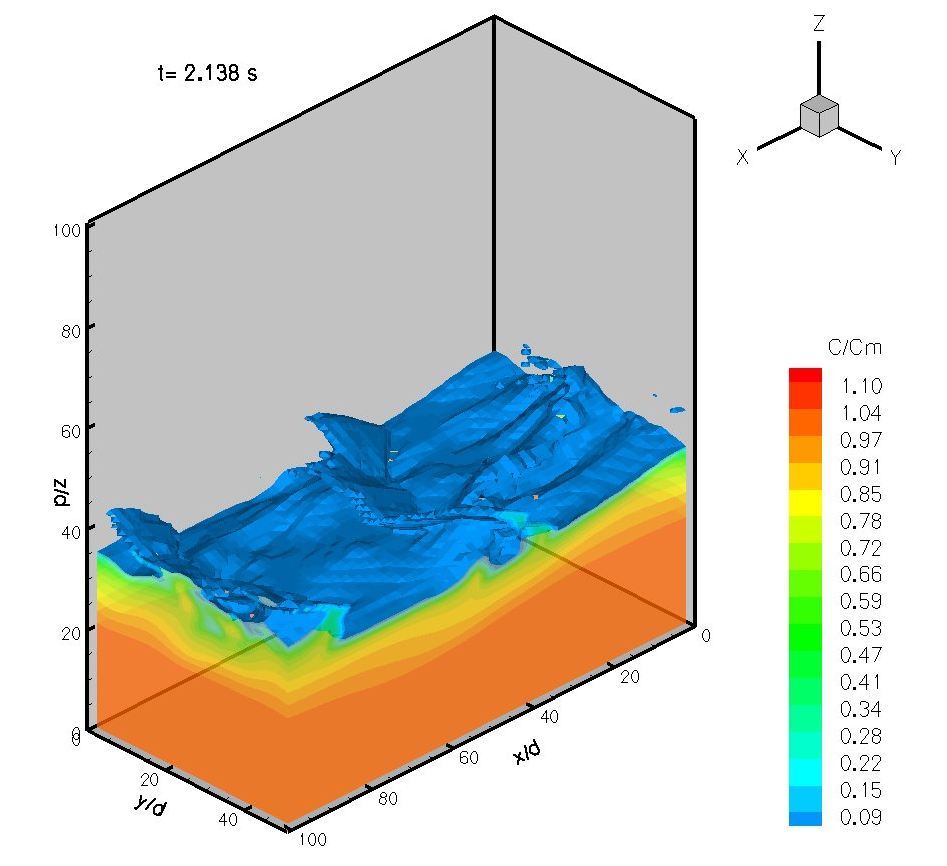
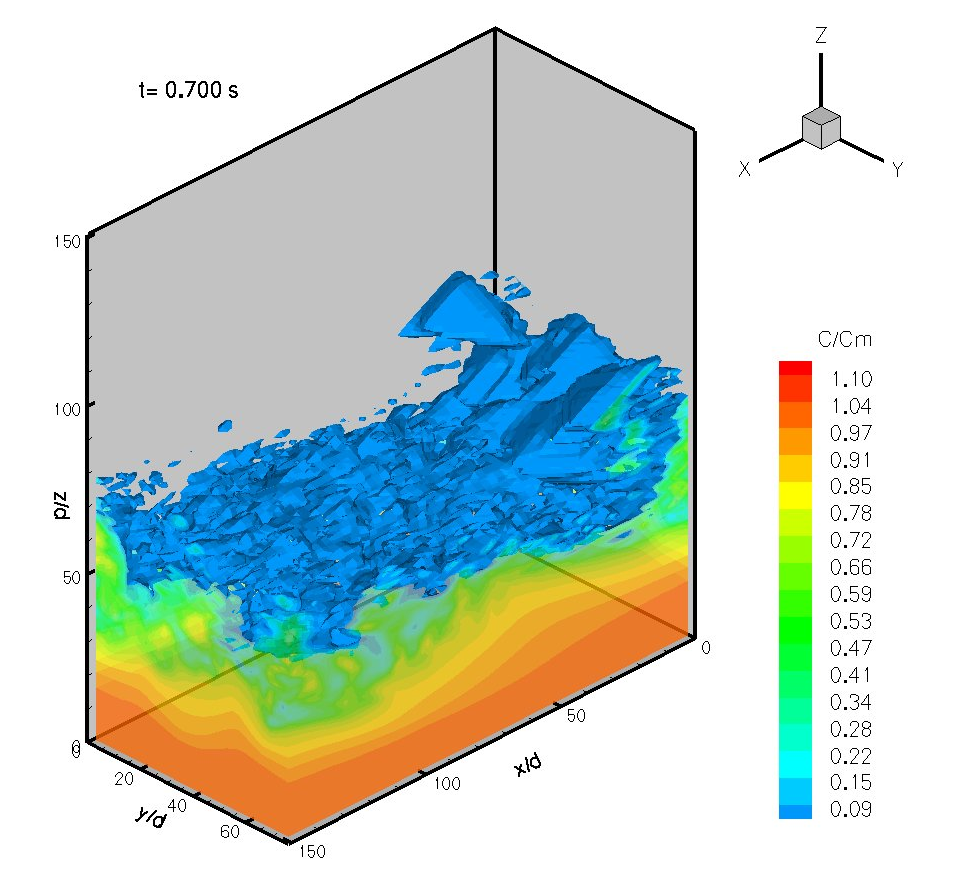
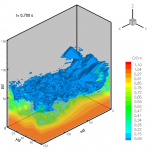
Sheet flow simulation #2, a 3D visualization of reference concentration of sediment in a 3 second period turbulent boundary layer. The blue iso-surface is the 5 percent concentration contour. |
 |
Sheet flow simulation of Horikawa’s experiment. Model results have similar mean flow properties to the lab measurements. |
 |
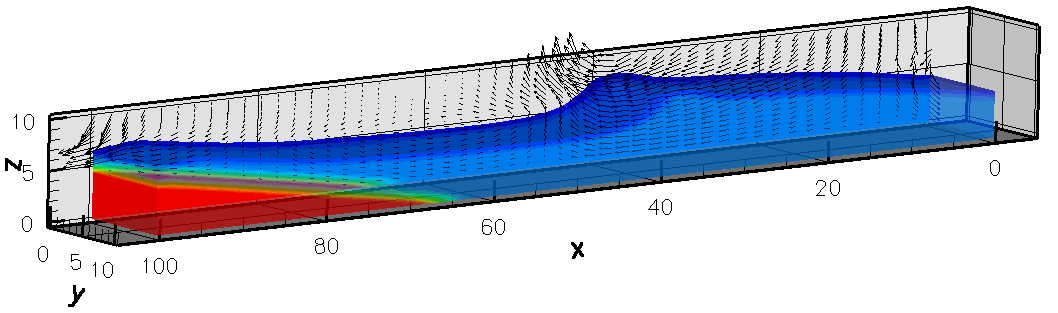
Volume of Fluid simulation of waves in a tank. Both the water and air are modeled together. Velocity vectors and density contours are shown. |